
MAP WORK
Components of a Map
List all the components of a map
These are basic prerequisites or qualities that any map should have. A map should have:
- a title, which tells what the map is about;
- a key which is used to interpret the signs and symbols found on a map;
- a margin which bounds the map;
- an indication of the north direction; and
- a scale for showing the relationship between the distance on the map and that on the ground.
Each of these components is discussed in detail below:
- Title:The title shows the topic or subject matter of the map. It gives the name of the area which the map represents or the features represented on that map. The name of the map enables the user to read and interpret the map easily.
- Key:A key is a list of symbols and signs with their meanings as used in the map. It appears in a box at one of the bottom comers of the map. When these symbols and signs are given in the key, it becomes easier to interpret a map and get accurate information from it.
- North direction:This is a sign which shows the north direction. The sign gives an indication of the direction towards the north. It is from this direction that other cardinal points and positional locations of different areas on a map can be identified.
- Margin:This is a frame which encloses the area covered by the map. The margin is useful in that it guides and limits the map users as they read maps.
- Scale:The scale of the map indicates the ratio between the map and ground distances. It enables the map readers to make accurate estimation of distances on the map as they would be measured on the ground.
A Scale and Different Ways Used in Representing a Scale
Define scale and identify different ways used in representing a scale
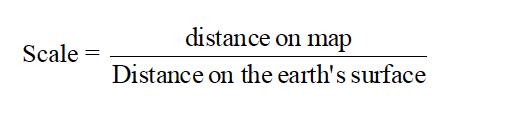
A scale is a ratio between the distance on the map and the true distance on the earth’s surface.
Maps drawn to scale show the exact proportionality between the distance on the ground and that on the map.
Map scales are very crucial because they enable the map readers to calculate actual distances and areas on the ground based on the scales shown on maps. It is not possible to estimate the actual distance between two points on a map or a particular area on a map without the use of the scale. Though every map should have the scale, sketch maps are usually not drawn to scale. Sketch maps are rough sketches drawn on a flat surface to represent a particular area on the ground.
Types of scales
Map scales are classified on two bases. They are classified based on:
- the way they are expressed; and
- their size.
Classification of scales based on the way they are expressed based on this mode, map scales may be expressed in any of the following ways:
- As a statement
- As a representative fraction
- As a linear scale
Statement scale
This is the map scale stated in words or it is a verbal scale. The scale may be stated as “one centimetre represents ten kilometres or 1 centimetre to 10 kilometres or 1 cm to 10 km.”
It should be noted that in all statement scales map distances are stated in centimetres and ground distances in kilometres.For example it is wrong to state” one centimetre represents five hundred metres. The correct statement is “one centimetre represents a half kilometre.”
Properties of statement scales
- They are expressed as word or verbal statements
- The scales bear specific units of measurement. Usually the units representing map distances are smaller than the actual ground distances, e.g. 1 cm represents 5 kilometres.
- The word “represent” and “not equal to” or “equivalent to” is used when expressing statement scales. For instance, do not state “one centimetre is equal to one kilometre”. This statement is wrong because one centimetre on a map is not exactly equal to one kilometre on the ground but just a scaled representative of the stated distance. The distance on the map is just taken as a representative of but not equal to the distance on the ground. The statement above is correctly stated as “one centimetre represents one kilometre”.
- The map distance always carries the digit 1 while that of the ground may be less than or equal to 1. For example 1 cm represents ? km, 1 cm represents 1 km.
Representative fraction (RF) scale
This is a type of scale which expresses the map distance as a fraction of the actual distance on the ground, for example, 1:10000 or 1/10000. This means that one unit on the map represents 10000 units on the ground.
Properties of RF scales
- The scales are either expressed as a ratio or fraction and do not bear any units. The units may be deduced from the linear or statement scale shown on the map.
- The top number (numerator) stands for the map distance and is always reduced to 1.
- The bottom number (denominator) stands for the ground distance and is usually more than 1.
It is important to note that when assigning units of measurement to RF scales, both the numerator and the denominator should bear the same units, e.g. 1 cm: 100 cm. The units used in most scales are centimetres. So, in case the units are not given, assume the units are in centimetres.
Example 1
Consider a map with an RF scale of 1/10000 or 1:100000. A river on this particular map measures 5 cm. Calculate the actual ground length of the river.
Solution
Since 1 cm on the ground represents 100000 cm on the ground, then 5 cm will represent 5?100,000 cm = 500,000 cm . But 1 km = 100,000 cm. then, the actual ground distance is 500,000/100,000 = 5km.
Linear (graph) scale
A linear scale or line scale or graph scale is a line showing the distance on the map that represents a given distance on the ground. It is expressed as a short or long line sub-divided into smaller, equal units. The linear scale is commonly placed at the bottom of the map. There are two categories of linear scales: the short-line scale and the long-line scale.
A short line scale consists of a single, short line that represents the actual ground distance. To get the unit of measurement on the map, one has to measure the length of the line in centimetres.
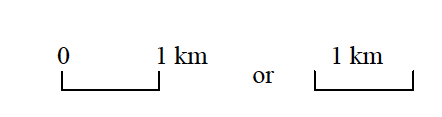
Short-line scale
A long line-scale consists of a long line that is sub-divided into several equal parts. It has two sections: the primary section and the secondary section.
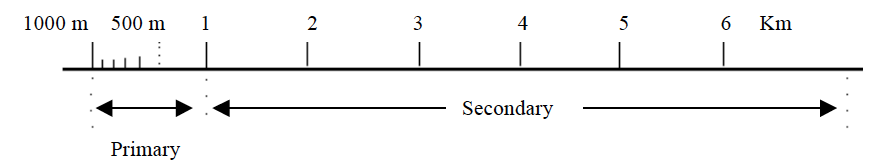
Linear scale
Properties of linear scales
- The scales are expressed graphically in the form of a line.
- They show the specific units of measurement.
- They give a direct measure of the distance on the ground represented by the corresponding distance on the map.
- The scale has the advantage of remaining the same even after the map is reduced or enlarged.
Classification of scales based on their sizes
Based on sizes, the scales are classified into three categories:
- Small scales
- Medium scales
- Large scales
Small scale
A map drawn using a small scale is called a small-scale map. A small-scale map has the following characteristics:
- It represents a large area of the earth’s surface on a piece of paper.
- The features on a small scale map appear crowded and closer to each other than they really are. As a result, they are not seen clearly.
- The map shows fewer details as it covers a large area on a piece of paper e.g. an atlas map of the world, Africa or Tanzania. It only gives a general picture of the area represented.
Examples of small scales are: 1:10,000,000 or 1 cm:100 km; 1:1,000,000 or 1 cm:10 km
Medium scale
This is a scale ranging between a small scale and a large scale.
Examples of medium scales are: 1:500,000 or 1 cm:5 km; 1:250,000 or 1 cm:2.5 km
Large scale
A map drawn using a large scale is called a large-scale map. A large-scale map has the following properties:
- The map shows many details of a small area on a piece of paper, e.g. a map drawn to represent a small area such as a town, a certain location or village etc. Therefore, more features can be represented on a large scale map.
- The map appears large in size though it represents a small part of the earth’s surface.
- The features on the map are large in size, so they can be seen quite clearly.
Examples of large scales are: 1:50,000 or 1cm:.0.5km; 1:25,000 or 1cm:.0.25km
Difference between Signs and Symbols
Distinguish and explain signs from symbols
The natural and artificial landscape features are represented on maps by means of symbols and signs. Symbols and signs are the alphabet or language of maps. As symbols and signs are important in giving information on a map they should have the following qualities. They should be.
- Easy to read;
- Easy to understand;
- Easy to interpret; and
- Correctly and clearly shown and presented on any map.
Symbols and signs are commonly shown at the key or reference or legend of the map. With the aid of a key, reference or legend we can read and interpret a map. Symbols that are used in maps usually look like the natural and artificial features they represent. Signs usually do not look like the features they represent. Also most of the symbols are pictorial while most signs are not.
The symbols and signs used on maps are used to improve the appearance and readability of the map. Various symbols are used to depict features such as buildings, mines, forests, water bodies, farmlands, etc.
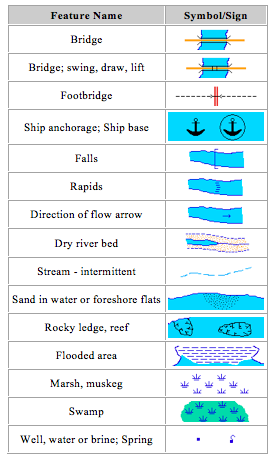
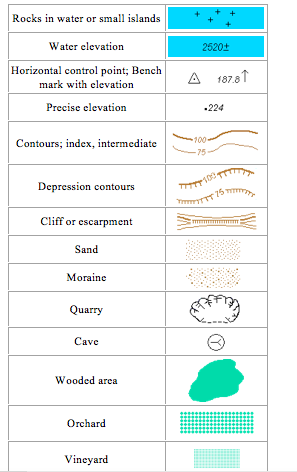
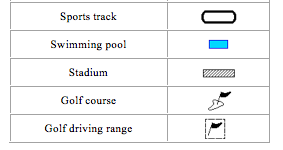
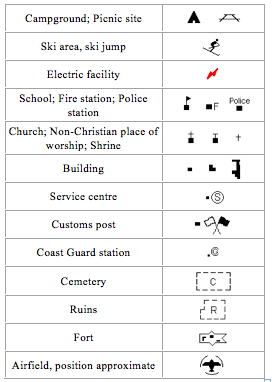
Symbols and signs often used in maps
The Distance on the Map and Converting to the Actual Ground by Using Scale
Measure the distance on the map and convert to the actual ground by using scale
One of the many tasks that a map reader might encounter when reading maps is to take measurements. Measurements on maps involve:
- measurement of distances; and
- calculation of areas on maps.
The conversion of map distances and areas into actual ground distances and areas requires the application of scales. A distance is the length between two specified points on a map.
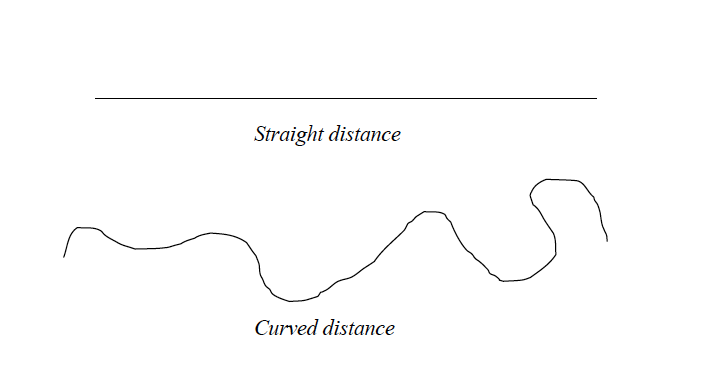
Measurement of distances on maps
Distances on maps can either be straight or curved (bent). A straight or regular distance is one that has no bends or curves while a curved (or irregular) distance is the one with bends or curves.
Tools for measuring distances
There are three main tools that are used for measuring distances on maps. These are:
- a long, thin string or thread;
- a piece of paper; and
- a pair of dividers.
Measurement of distance using a thread or string
A long, thin string such as sewing thread can be used to measure a stretch of many curves or bends. This is the commonest method used by geography students to estimate distances on maps. This method is also used to estimate straight distances.
Procedures
- Identify the distance to be measured on the map (e.g. a river, road, railway line, etc) and mark its two ends with a sharp pencil. Mark one end as A and the other as B.
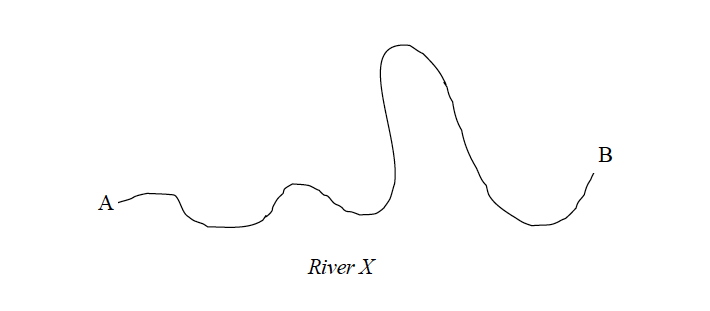
- Starting from one end of the string, trace the route (river, road, etc) with a string as shown in the figure below:
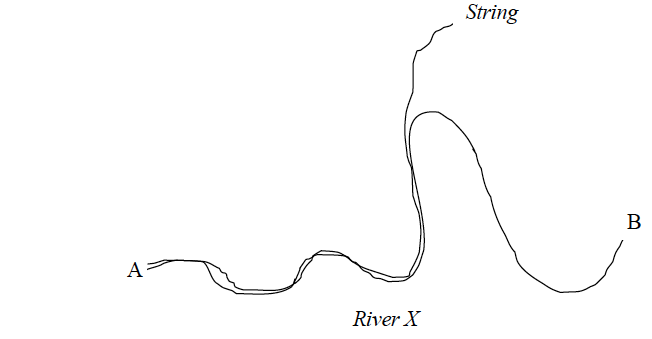
- Mark the string with an ink at point B.
- Using a ruler or linear scale, measure the length of the string between point A and B and estimate the actual distance on the ground using the scale of the map provided.
Example 2
If the length of the section of the string between A and B is 20 cm and the scale of the map is one centimetre to one kilometre, then the length of the route on the ground is 20 km.
Measurement of distances using a piece of paper
A piece of paper can also be used to measure straight and irregular (curved, bent) distances
Measuring straight distances
Procedures
- Locate the distance to be measured on the map and mark its two ends as A and B using a sharp pencil.
- Take a piece of paper, fold it to form a straight edge and lay the edge along the line AB and mark the exact length of the line on the edge of the paper as shown in the figure below.
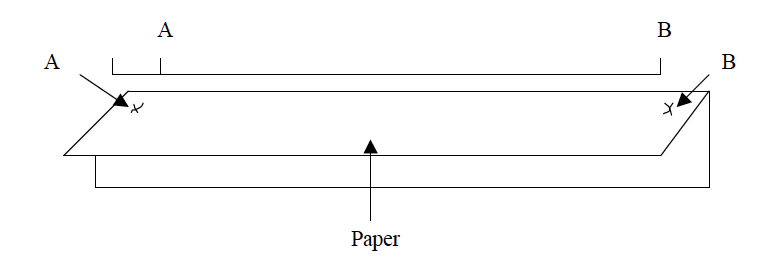
- Transfer the paper to a linear scale (or ruler) as indicated in the figure below so that the left hand mark (A) is on 0 (zero).
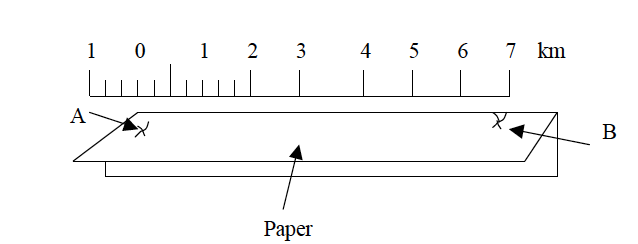
- Use the provided scale to estimate the actual ground distance.
Measuring irregular (curved) distances
Procedures
- Identify the length to be measured on the map. Use a sharp pencil to mark both ends A and B.
- Divide the route into sections which are more or less straight as shown in the figure below.
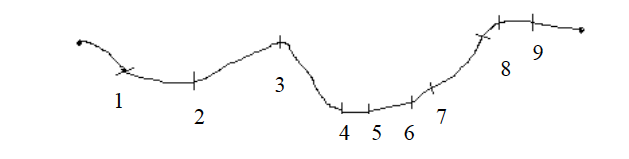
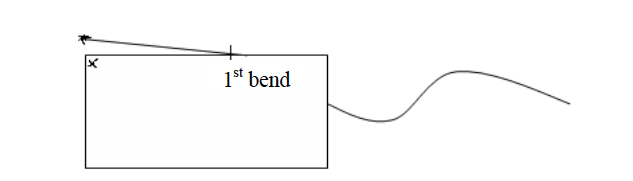
- Lay the straight edge of the paper on the first straight section of the route. Mark with your pencil where the route bends (point 1).
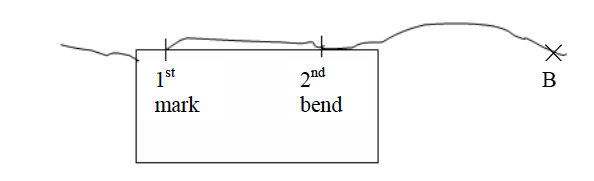
- Turn the paper so that the edge now lies along the second part of the route. Make sure that the mark you made is still on the point where the route bends. Now make another mark with your pencil at the bend (point 2).
- Continue shifting the paper and marking the other distances between the points on the route.
- Remove the marked paper, and using a ruler, measure from where you started to the last mark on the paper. If this distance is 20 cm and the scale is 1 cm to 1 km, then the distance of the route between A and B is 20 km.
Measuring distances using a pair of dividers
Measuring straight distances procedures
- Locate the distance to be measured on the map and mark its two ends using a pencil.
- Use a pair of dividers to measure the distance between the two end points on the map.
- If the distance is longer than the length of the dividers even when fully stretched measure the distance in sections and then sum up the lengths of all sections to get the total length.
- Place the divider on the linear scale and read the distance. Then use the scale to convert the obtained map distance into the actual ground distance.
Measuring irregular (curved or bent) distances
- Division method
- Stepping method
Division method
Procedures
- Divide the river, road, railway, etc into many, short straight distances.
- Open your dividers and measure all distances as shown in the figure below.
- Add up the map lengths of all sections along the route.
- Use the linear scale to get the actual ground length from the sum obtained in (iii) above. The length of the route is equal to the sum of all sections, divisions or short distances.
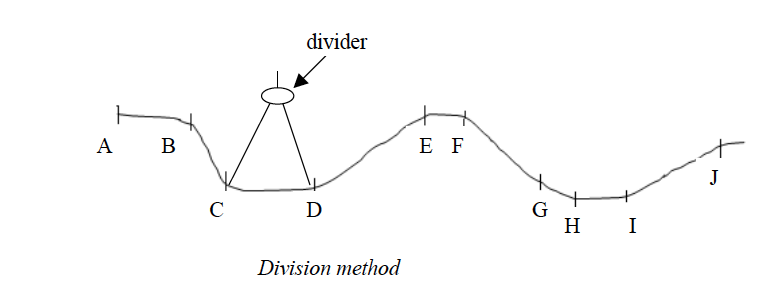
Add up all the measurements: AB = 1 km; BC = 1 km; CD = 1 km; DE = 2 km; EF = 0.5 km; FG = 2 km; GH = 0.5 km; HI= 1 km; IJ = 2 km = Total length = 10 km.
Stepping method
- Open and set the pair of dividers to a known distance by using the linear scale e.g. quarter or half a kilometre as shown in the figure below.
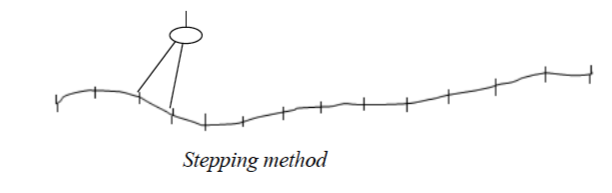
- Follow the river, road or line by stepping along it using the set dividers.
- Add up the number of steps and multiply by quarter or half a kilometre (depending on the set length).
Example 3
Suppose number of steps when the divider is opened to a quarter kilometres wide is 20 and when it is a half, kilometre is 10. Then, the length of the route is:
10 x ? = 5 or 20 x ? = 5 kilometres
Note that if the distance of the last step is less than the set distance of the dividers, measure it separately and estimate its distance on the linear scale. Add up this distance to the total distance from the steps to get the full distance of the route (river, road or line).
Areas of Regular and Irregular Figures
Calculate areas of regular and irregular figures
The figures whose areas are to be calculated on maps can either be regular or irregular
Calculating areas of irregular shapes
Features with regular shapes on maps are rectangular, triangular, square or circular. Finding the areas of such figures is simple. Mathematical formulae are used to calculate their areas. However, it is not common to find regular features on maps.
Calculating areas of different regular shapes
- Triangles = L x W, where L = length and W = width.
- Squares =L2, where L = length of the side of a square.
- Triangles = ?bh, where b = length of the base and h = length of the height.
- Circle = πr2 or πD2/4, where r = radius, D = diameter and π = 3.14 or 22/7
Calculating areas of irregular shapes: Features with irregular shapes are very common on maps. These may include shapes of lakes, forests, plantations, settlements, marshy land, etc.
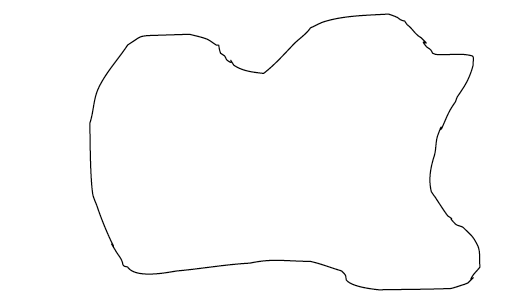
An irregular shape
There are three methods used to calculate areas of irregular shapes. These are the:
- division method;
- tracing method; and
- grid square method.
Division method
In this method, the area to be measured is divided into rectangles or squares and triangles or into several strips of the same length and width. Then, the area of each resulting figure is calculated using mathematical formula and summed up to get the total area.
- Divide the whole area into rectangles, squares or triangles.
- Calculate the areas of the rectangles, squares and triangles using mathematical formulae.
- Sum up individual areas to get the total area Remember that the area should be in the same units as the map scale.
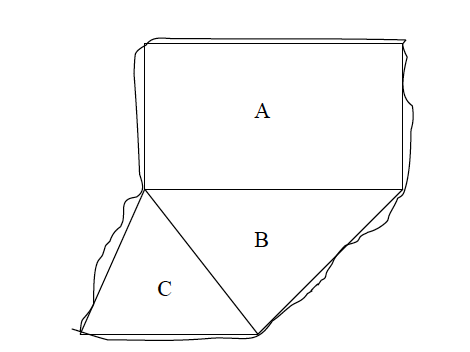
Example 4
The area above is divided into three figures A, B and C. The area of the three resulting figures is calculated as follows:
Rectangle A: Area = L x W = 10 x 5 = 50 km2
Triangle B: Area = ½bh = ½x 6 x 4 = 12 km2
Triangle C: Area = ½bh = ½x 4 x 3 = 6 km2
Total area = A + B+ C = 50 +12+6 = 68 km2
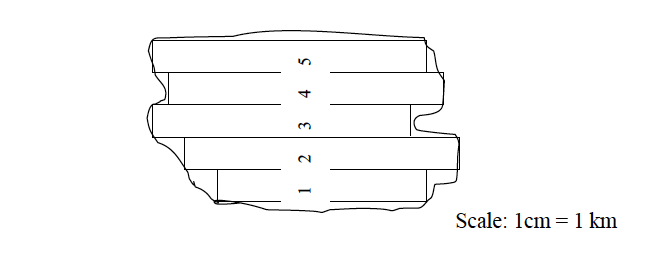
Division of the area into strips
The stripping method involves dividing the area into strips and then calculating the area of each strip separately. The total area is obtained by summing up the areas of all rectangular strips.
Procedures
- Divide the area into uniform rectangular strips.
- Calculate the area of each rectangular strip separately. Remember that the areas of the strips should be in the same units as the scale of the map.
- Add up the area of each strip to get the total area.
Area = sum of the areas of all individual strips = area of 1 + 2 + 3 + 4 + 5
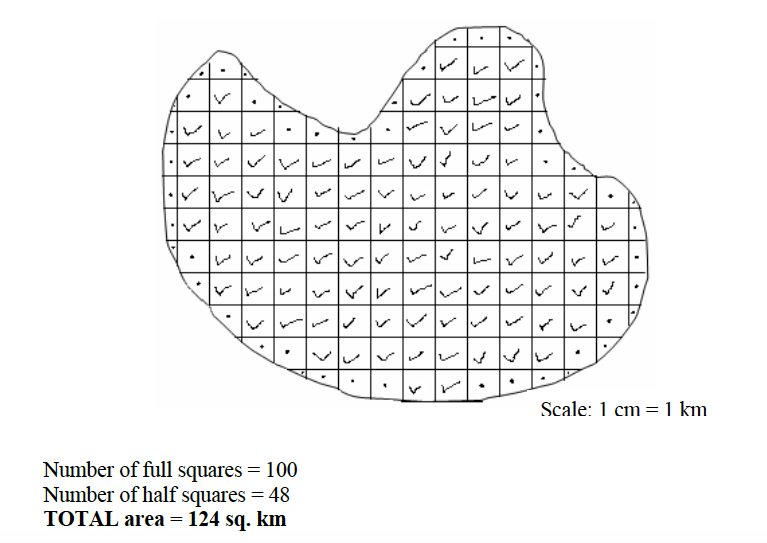
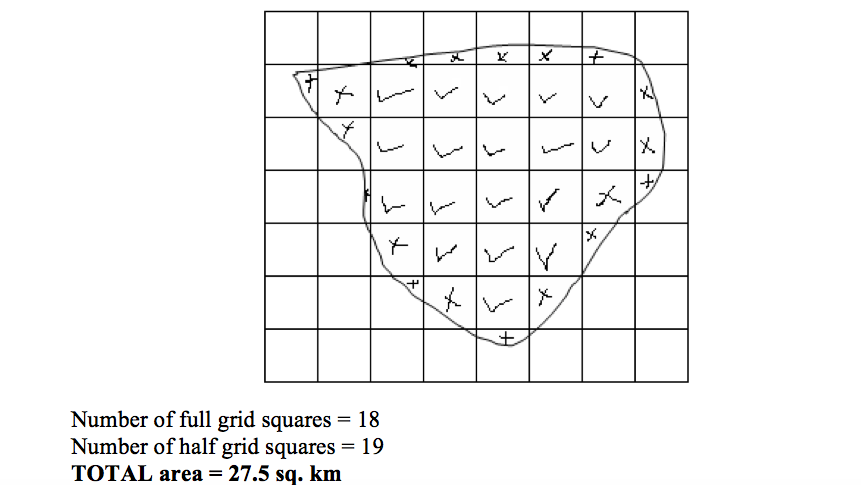
Tracing method
- Trace off the outline (boundary) of the figure to be measured onto a tracing paper (graph paper) or ordinary tracing paper and transfer the outline onto a squared paper.
- Tick and count all complete squares and sum up their areas. Remember that each full square measures 1 cm x 1 cm.
- Mark all incomplete squares with crosses.
- Count all incomplete squares and divide the sum by 2 to get the number of complete squares.
- Add up the squares in (iii) and (iv) to get the total number of squares covering the area of the figure to be estimated.
- Using the scale provided, find the area of one square in order to obtain the actual area that would be covered on the ground. Note that the area that you calculate is the approximate area.
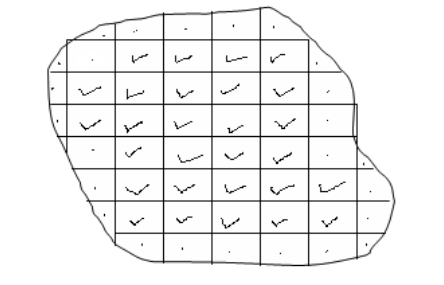
According to the figure above, the number of complete squares is 28. The number of incomplete squares is 25. To get the complete squares, we divide 25 by 2, i.e., 25 ÷ 2 =12.5
Hence the total number of complete squares = 28 +12.5 = 40.5. This is the same as 40.5 cm2.
Assume that the scale of the map is 1:50,000. Then, the area of 1cm by 1cm on the ground is 0.5 x 0.5 km = 0.25 km2
Therefore, the total actual ground area of the irregular shape is calculated thus: Area = 40.5 x 0.25 =10.125 km2.
Remember that if you don’t have the tracing paper you can draw the squares straight on the map using the following procedures:
- Mark by a pencil the margin of area to be measured.
- Using the grid reference lines as your guidelines, draw the squares with faint pencil lines across the area. If there are no grid lines make sure you draw right angled squares across the figure.
- Mark your full squares and half squares and follow the above tracing method procedures for calculating the area.
The grid square method
If the map provided has grid lines, the grid square method can be used to calculate the area on the map. The grid squares formed by the lines are used in this case. For example, in a topographical map of scale 1:50,000 the distance between two successive grid lines is 2 cm. This length is equivalent to 1 km on the ground. Therefore, every grid square on a 1:50,000 map represents 1 km2 on the ground. Consider the diagram below:
The procedures for calculating the area of a figure on a map with grid squares are similar to those used in the tracing method discussed previously in this chapter.
Location of Position
Identify location of position
In map reading, position is a place where an object is situated on the earth’s surface. The geographic position of a place may be shown by using:
- Place names
- Compass bearing
- Latitude and longitude
- Grid reference
- Political and administrative boundaries
Use of place names
Names of places on maps may be used to locate the position of an area or place. Names of places e.g. Morogoro, Tarime, Mbeya, etc are clearly marked and shown on maps.
Compass bearing
Many years ago it was discovered that a magnetized piece of iron or needle, if hung or allowed to swing freely, will always point to the same direction. This direction is called the North. It is from the north direction that we measure other directions, that is, East, West and South.
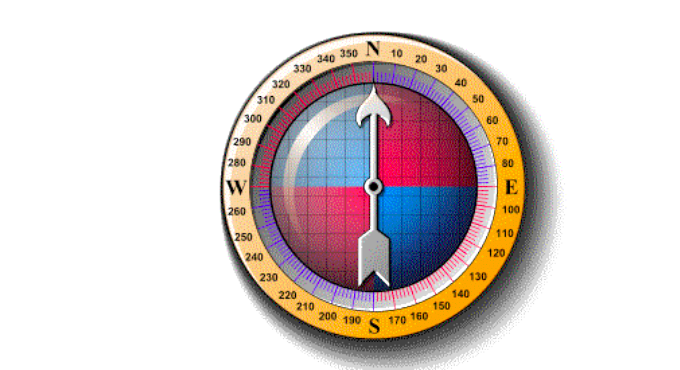
A compass is an instrument used to measure directions from the north. It consists of a free-swinging, magnetized needle which points to the north and south magnetic poles.
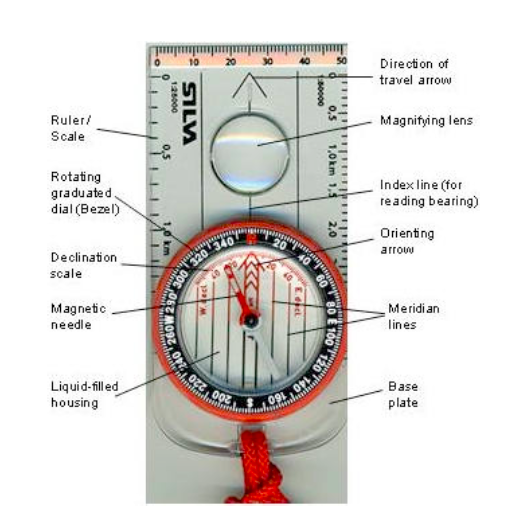
A compass
The compass can be used to show directions in the following ways:
North direction
The north direction may be shown by using; Geographic or True North; Magnetic North and Grid Nortn.
- Geographic or True North is the direction towards the North Pole from any place on the earth’s surface. It is always indicated by the north arrow. When reading directions on maps we usually use the True North.
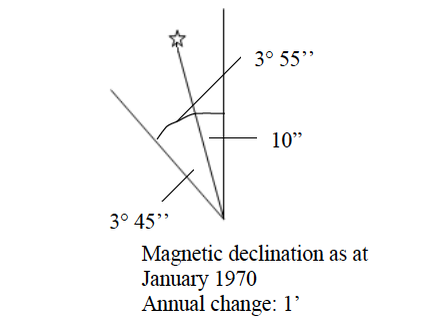
- Magnetic North is the direction to which the compass needle points. The magnetic North is some distance from the True North and also varies from year to year in relation to the True North.
- The Grid North is the direction towards the north in those maps drawn to grid system.
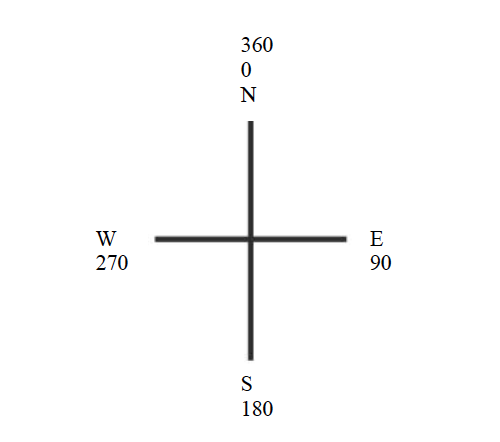
Compass directions
There are four major directions, bearings or cardinal points on maps with respect to a fixed point, be it true North or magnetic North. They are marked by 90º.
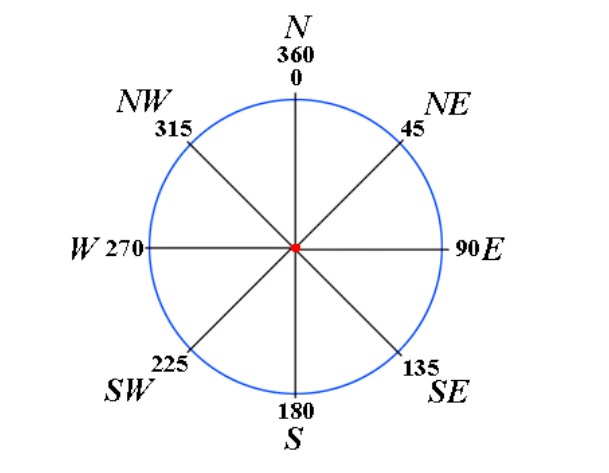
The four cardinal points can further be sub-divided into eight points of 45º
The eight points of a compass can further be sub-divided into sixteen points of 22.5º
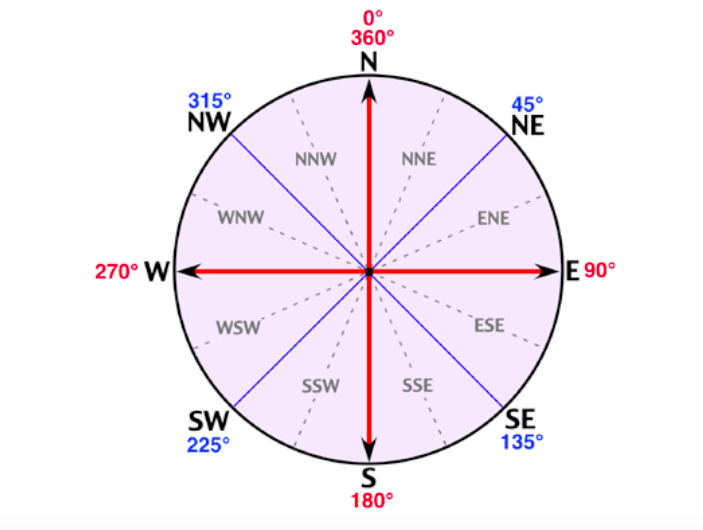
Bearings of a compass
Compass bearing shows the direction of a point with respect to another point measured clockwise from 0o to 360o. Bearing is expressed in degrees which are further sub-divided into minutes and seconds.
Bearings of a compass
Grid reference
A grid system is a pattern of horizontal and vertical lines forming squares of uniform sizes drawn on a map. Grid system is numbered East and North and is referred in terms of Easting and Northing.
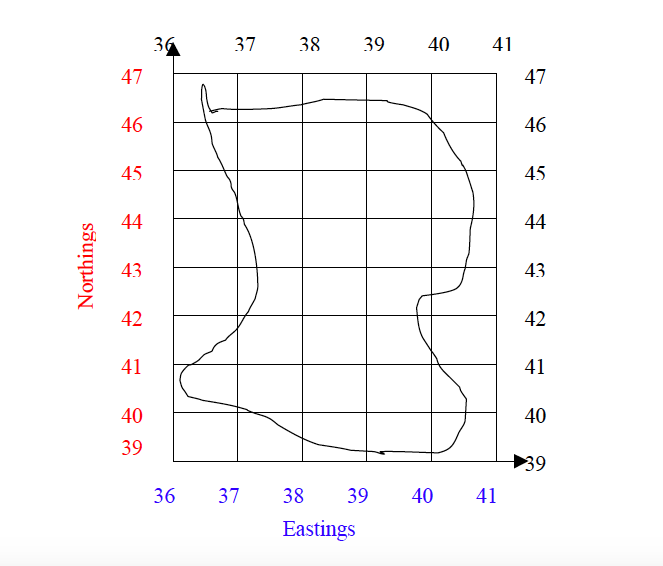
Grid lines are not lines of latitude and longitude, but are drawn to a definite distance apart, which varies according to the scale of the map and unit of measurement used in a map. The reading in a grid system is referred to as grid reference and is given in a six-figure number.
Using grid reference
- The full grid reference is given in a six-figure number.
- Easting – the eastward direction or reading are always given first.
- Northing – the northward direction or reading follows after the Easting.Example Easting = 351 Northing = 421 Full grid reference = 351421
- When a place or point falls on the main gridlines or bisected by the grid line, add 0 to each reading Example A place is bisected by:- Easting =35 Northing = 40 The grid reference of a point will be 350400
- When a place or point falls in the middle of a grid square, the grid square is sub-divided into ten equal squares or tenths. The grid reading or direction is given to the nearest tenths. Consider the point, A, in the figure below). Example See point B in the figure below. The point lies between the following grid reference: Easting = 35 Northing = 42
Procedures
- Divide the grid square into tenth to locate the point or place. For example, point A in the figure below lies at:- Easting = 5 tenths Northing = 5 tenths
- Read the easting adding the 5 tenth digit = 565
- Read the nothing adding the 5 tenth digit =225
- Full grid reference of the point is 565225
Direction and Bearing of Object on Maps
Find direction and bearing of object on maps
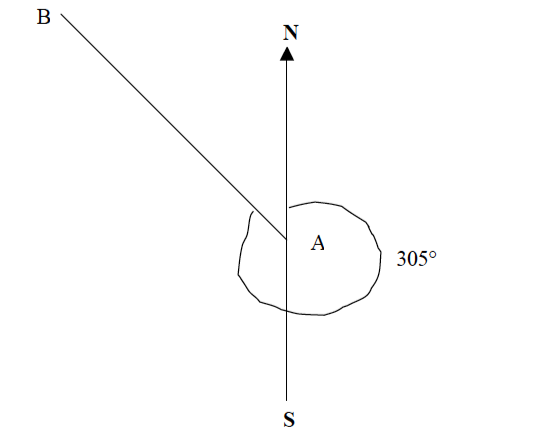
The bearing of a lace on a map can be found when the north is given. The North is usually an arrow sign pointing to the north.
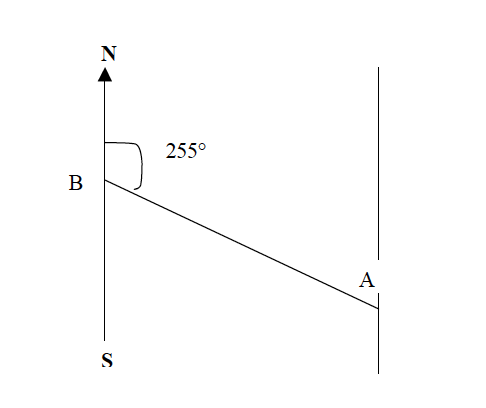
Example 5
Find the bearing of point B from point A.
Procedures
- Join points B and A with a straight line.
- At point A, draw a line parallel to the north-south line.
- Using a protractor, measure the angle B from the north towards line BA as shown below.
Direction of a place
The direction of a place or point is its direction with respect to another point measured by using the points of the compass e.g. North, South, East and West.
Example 6
Find the direction of point B from point A.
Procedures
- Join points A and B with a straight line.
- At point A, draw a line parallel to the north-south line or compass direction sign that is given on a map.
- Draw a horizontal line at point A to get the East and West of the four points of the compass.
- Find the direction of point B from A to the nearest point of the compass. The four, eight or sixteen points of a compass may be used.
When finding angular bearing or direction of a compass, always use the “True North” which is given on the map.

No comments:
Post a Comment